| symbol | name | channel | source | asset_type | frequency | needs_key | |
|---|---|---|---|---|---|---|---|
| 0 | SPY | SPDR S&P 500 ETF Trust | Broad-market baseline | yfinance | equity-ETF | business-day | False |
| 1 | XLE | Energy Select Sector SPDR Fund | Energy | yfinance | equity-ETF | business-day | False |
| 2 | ITA | iShares U.S. Aerospace & Defense ETF | Defense procurement | yfinance | equity-ETF | business-day | False |
| 3 | DBA | Invesco DB Agriculture Fund | Agricultural commodities | yfinance | equity-ETF | business-day | False |
| 4 | BDRY | Breakwave Dry Bulk Shipping ETF | Shipping & insurance | yfinance | equity-ETF | business-day | False |
| 5 | GLD | SPDR Gold Shares | Safe havens & FX | yfinance | equity-ETF | business-day | False |
| 6 | ^VIX | CBOE Volatility Index | Safe havens & FX | yfinance | index | business-day | False |
| 7 | UUP | Invesco DB US Dollar Index Bullish Fund | Safe havens & FX | yfinance | equity-ETF | business-day | False |
| 8 | BTC-USD | Bitcoin (USD) | Crypto (regime-dependent) | yfinance | crypto | daily | False |
| 9 | ETH-USD | Ethereum (USD) | Crypto (regime-dependent) | yfinance | crypto | daily | False |
| 10 | LMT | Lockheed Martin Corp. | Defense procurement | yfinance | equity | business-day | False |
| 11 | DGS10 | 10-Year Treasury Constant Maturity Rate | Safe havens & FX | fred | rate | business-day | True |
| 12 | DGS2 | 2-Year Treasury Constant Maturity Rate | Safe havens & FX | fred | rate | business-day | True |
| 13 | T10Y3M | 10Y minus 3M Treasury Spread | Macro context | fred | rate-spread | business-day | True |
| 14 | DCOILWTICO | WTI Crude Oil Spot Price | Energy | fred | commodity-price | business-day | True |
| 15 | DHHNGSP | Henry Hub Natural Gas Spot Price | Energy | fred | commodity-price | business-day | True |
| 16 | VIXCLS | CBOE Volatility Index (FRED) | Safe havens & FX | fred | index | business-day | True |
| 17 | CPILFESL | Core CPI (All Urban, less food & energy) | Macro context | fred | macro-index | monthly | True |
| 18 | UNRATE | Unemployment Rate | Macro context | fred | macro-rate | monthly | True |
| 19 | WPU01210101 | PPI by Commodity: Farm Products: Wheat | Agricultural commodities | fred | macro-index | monthly | True |
| 20 | BAMLH0A0HYM2 | ICE BofA US High Yield OAS | Credit / risk regime | fred | credit-spread | business-day | True |
| 21 | BAMLC0A0CM | ICE BofA US Corporate (IG) OAS | Credit / risk regime | fred | credit-spread | business-day | True |
| 22 | BAA10Y | Moody's Baa Corporate minus 10Y Treasury (cred... | Credit / risk regime | fred | credit-spread | business-day | True |
| 23 | AAA10Y | Moody's Aaa Corporate minus 10Y Treasury (cred... | Credit / risk regime | fred | credit-spread | business-day | True |
| 24 | NFCI | Chicago Fed National Financial Conditions Index | Financial conditions | fred | index | weekly | True |
| 25 | ANFCI | Chicago Fed Adjusted NFCI | Financial conditions | fred | index | weekly | True |
| 26 | T10YIE | 10-Year Breakeven Inflation Rate | Inflation expectations | fred | rate | business-day | True |
| 27 | DFII10 | 10-Year TIPS Real Yield | Real rates | fred | rate | business-day | True |
| 28 | DFF | Effective Federal Funds Rate | Monetary policy | fred | rate | business-day | True |
| 29 | M2SL | M2 Money Supply (seasonally adjusted) | Liquidity | fred | macro-level | monthly | True |
| 30 | INDPRO | Industrial Production Index | Growth (coincident) | fred | macro-index | monthly | True |
| 31 | SAHMREALTIME | Sahm Rule Recession Indicator (real-time) | Recession regime | fred | macro-rate | monthly | True |
| 32 | HG=F | COMEX Copper Futures (Dr. Copper) | Commodity / growth barometer | yfinance | commodity | business-day | False |
| 33 | ICSA | Initial Unemployment Claims (weekly, SA) | Labor market (leading) | fred | macro-index | weekly | True |
| 34 | PAYEMS | All Employees, Total Nonfarm | Labor market (coincident) | fred | macro-index | monthly | True |
| 35 | AWHAEMAN | Avg Weekly Hours, Manufacturing | Labor market (leading) | fred | macro-rate | monthly | True |
| 36 | PERMIT | New Private Housing Units Authorized (Building... | Housing (leading) | fred | macro-index | monthly | True |
| 37 | HOUST | New Private Housing Units Started (Housing Sta... | Housing (leading) | fred | macro-index | monthly | True |
| 38 | NEWORDER | Mfrs New Orders: Nondefense Capital Goods ex-A... | Capex (leading) | fred | macro-index | monthly | True |
| 39 | UMCSENT | University of Michigan Consumer Sentiment | Sentiment / expectations | fred | macro-index | monthly | True |
| 40 | EUR/USD | EUR/USD daily (Alpha Vantage FX_DAILY) | Safe havens & FX | alphavantage | FX | business-day | True |
| 41 | PET.RWTC.D | WTI Crude Oil Spot (EIA) | Energy | eia | commodity-price | business-day | True |
| 42 | EURO | Treasury Reporting Rate of Exchange — Euro | Safe havens & FX | treasury | FX | quarterly | False |
3 Data Understanding
CRISP-DM Phase 2. Collect initial data and build familiarity with it, identify data-quality problems, and form first hypotheses. See The CRISP-DM Process for the methodology overview.
This chapter executes the second CRISP-DM phase for PortfolioLens. It picks up the Business Understanding hand-off — baseline-first, multi-horizon, a Sharpe-based objective, and the six transmission channels (energy, agricultural commodities, defense, safe-havens & FX, shipping, regime-dependent crypto) — and asks the Phase-2 question: what data can we actually get, for free, and is it good enough to build on?
This revision also contextualizes the data against the indicator catalog in strategy.md: §5 maps every series onto that catalog’s leading/coincident/ lagging and regime framework and ranks the highest-value indicators for the prediction model, and a companion appendix — Indicator Council Deliberation — records a six-expert debate on which indicators are genuinely useful for predicting the best-performing investments. Per CRISP-DM, this chapter studies and ranks the available signals; the features themselves are constructed in Data Preparation — momentum, rolling z-scores, the diffusion-LEI proxy, and the equal-weighted regime score.
Everything below is computed from a pinned, cached data snapshot (vintage 2026-06-03) produced by a one-time pull script. The chapter performs no live API calls when it renders; see §10 Reproducibility for how the snapshot is created and refreshed.
3.1 1. From business goals to a data problem
The Phase-1 thesis — geopolitical shock → economic transmission channel → asset re-pricing → opportunity — tells us where to look. Phase 2 tests whether the look is even possible with the mandated free sources: Yahoo Finance (yfinance), FRED, Alpha Vantage, and US-government APIs (EIA, US Treasury). Detailed source notes live in financial-data-sources.md; this chapter is the working record of actually pulling and vetting the data.
The four Phase-2 deliverables follow in order: collect → describe → explore → verify quality, now bridged to the strategy catalog in between.
3.2 2. Data sources & the free-source constraint
| Source | Auth | Free-tier limit | Used here for | Note |
|---|---|---|---|---|
| yfinance (Yahoo) | none | unofficial scraper | equities, ETFs, indices, crypto, copper OHLCV | breaks silently |
| FRED | API key | ~120 req/min | rates, macro, credit, conditions, commodity spots | pulled via keyless fredgraph.csv (full history) |
| Alpha Vantage | API key | 25 req/day, 5/min | FX (EUR/USD demo) | one call, cached |
| EIA v2 | API key | ~no hard cap | petroleum (WTI demo) | cross-checks FRED WTI |
| US Treasury fiscaldata | none | open | reporting exchange rates | keyless |
The Alpha Vantage 25-requests-per-day ceiling is the decisive design constraint: a single edit-render loop would exhaust it. That is why this project uses a cached architecture — a one-time pull writes the data to disk, and the book reads from disk forever after. As a bonus, the rendered book needs no API keys at all, so it builds on any machine from the committed snapshot.
Key handling. Keys live in a gitignored .env (template: .env.example); yfinance and Treasury need none. FRED is pulled via its keyless fredgraph.csv endpoint — it returns full history and sidesteps the per-key rate-limit/windowing that truncated some series, so the FRED API key is reserved for ALFRED point-in-time (vintage) data in Phase 3 (see §9).
3.3 3. Collect initial data
3.3.1 3.1 The instrument universe
The PoC universe maps each transmission channel and indicator role to concrete, free-to-obtain instruments. It is defined once in scripts/poc_universe.py:
3.3.2 3.2 How each source is pulled
The real fetchers live in scripts/poc_fetch.py; the orchestrator is scripts/poc_pull.py. The canonical call per source (shown, not executed at render time):
# yfinance — split/dividend-adjusted OHLCV, no key
import yfinance as yf
spy = yf.download("SPY", start="2000-01-01", end="2026-06-03", auto_adjust=True)

# FRED — keyless public CSV endpoint (full history; no pandas-datareader, which breaks on pandas 3.x)
import io, requests, pandas as pd
csv = requests.get("https://fred.stlouisfed.org/graph/fredgraph.csv",
                   params={"id": "BAA10Y", "cosd": "2000-01-01", "coed": "2026-06-03"}).text
baa10y = pd.read_csv(io.StringIO(csv), na_values=["."])

# Alpha Vantage — FX (key required; <=25 calls/day, 12s spacing)
av = requests.get("https://www.alphavantage.co/query",
                  params={"function": "FX_DAILY", "from_symbol": "EUR", "to_symbol": "USD",
                          "outputsize": "full", "apikey": "<ALPHAVANTAGE_API_KEY>"}).json()

# EIA v2 — petroleum series (key required)
eia = requests.get("https://api.eia.gov/v2/seriesid/PET.RWTC.D",
                   params={"api_key": "<EIA_API_KEY>"}).json()

# US Treasury fiscaldata — reporting rates of exchange (no key)
tr = requests.get("https://api.fiscaldata.treasury.gov/services/api/fiscal_service"
                  "/v1/accounting/od/rates_of_exchange",
                  params={"filter": "country_currency_desc:in:(Euro Zone-Euro)"}).json()
3.3.3 3.3 Initial data collection report
What the snapshot pull actually retrieved (the executed manifest of cached files):
| symbol | channel | source | frequency | start | end | n_rows | |
|---|---|---|---|---|---|---|---|
| 0 | SPY | Broad-market baseline | yfinance | business-day | 2000-01-03 | 2026-06-02 | 6643 |
| 1 | XLE | Energy | yfinance | business-day | 2000-01-03 | 2026-06-02 | 6643 |
| 2 | ITA | Defense procurement | yfinance | business-day | 2006-05-05 | 2026-06-02 | 5050 |
| 3 | DBA | Agricultural commodities | yfinance | business-day | 2007-01-05 | 2026-06-02 | 4882 |
| 4 | BDRY | Shipping & insurance | yfinance | business-day | 2018-03-22 | 2026-06-02 | 2060 |
| 5 | GLD | Safe havens & FX | yfinance | business-day | 2004-11-18 | 2026-06-02 | 5417 |
| 6 | ^VIX | Safe havens & FX | yfinance | business-day | 2000-01-03 | 2026-06-02 | 6644 |
| 7 | UUP | Safe havens & FX | yfinance | business-day | 2007-03-01 | 2026-06-02 | 4845 |
| 8 | BTC-USD | Crypto (regime-dependent) | yfinance | daily | 2014-09-17 | 2026-06-02 | 4277 |
| 9 | ETH-USD | Crypto (regime-dependent) | yfinance | daily | 2017-11-09 | 2026-06-02 | 3128 |
| 10 | LMT | Defense procurement | yfinance | business-day | 2000-01-03 | 2026-06-02 | 6643 |
| 11 | DGS10 | Safe havens & FX | fred | business-day | 2000-01-03 | 2026-06-02 | 6892 |
| 12 | DGS2 | Safe havens & FX | fred | business-day | 2000-01-03 | 2026-06-02 | 6892 |
| 13 | T10Y3M | Macro context | fred | business-day | 2000-01-03 | 2026-06-02 | 6892 |
| 14 | DCOILWTICO | Energy | fred | business-day | 2000-01-03 | 2026-06-01 | 6891 |
| 15 | DHHNGSP | Energy | fred | business-day | 2000-01-03 | 2026-06-01 | 6891 |
| 16 | VIXCLS | Safe havens & FX | fred | business-day | 2000-01-03 | 2026-06-02 | 6892 |
| 17 | CPILFESL | Macro context | fred | monthly | 2000-01-01 | 2026-04-01 | 316 |
| 18 | UNRATE | Macro context | fred | monthly | 2000-01-01 | 2026-04-01 | 316 |
| 19 | WPU01210101 | Agricultural commodities | fred | monthly | 2000-01-01 | 2026-04-01 | 316 |
| 20 | BAMLH0A0HYM2 | Credit / risk regime | fred | business-day | 2023-06-05 | 2026-06-02 | 794 |
| 21 | BAMLC0A0CM | Credit / risk regime | fred | business-day | 2023-06-05 | 2026-06-02 | 794 |
| 22 | BAA10Y | Credit / risk regime | fred | business-day | 2000-01-03 | 2026-06-01 | 6891 |
| 23 | AAA10Y | Credit / risk regime | fred | business-day | 2000-01-03 | 2026-06-01 | 6891 |
| 24 | NFCI | Financial conditions | fred | weekly | 2000-01-07 | 2026-05-29 | 1378 |
| 25 | ANFCI | Financial conditions | fred | weekly | 2000-01-07 | 2026-05-29 | 1378 |
| 26 | T10YIE | Inflation expectations | fred | business-day | 2003-01-02 | 2026-06-02 | 6109 |
| 27 | DFII10 | Real rates | fred | business-day | 2003-01-02 | 2026-06-02 | 6109 |
| 28 | DFF | Monetary policy | fred | business-day | 2000-01-01 | 2026-06-02 | 9650 |
| 29 | M2SL | Liquidity | fred | monthly | 2000-01-01 | 2026-04-01 | 316 |
| 30 | INDPRO | Growth (coincident) | fred | monthly | 2000-01-01 | 2026-04-01 | 316 |
| 31 | SAHMREALTIME | Recession regime | fred | monthly | 2000-01-01 | 2026-04-01 | 316 |
| 32 | HG=F | Commodity / growth barometer | yfinance | business-day | 2000-08-30 | 2026-06-02 | 6467 |
| 33 | ICSA | Labor market (leading) | fred | weekly | 2000-01-01 | 2026-05-23 | 1378 |
| 34 | PAYEMS | Labor market (coincident) | fred | monthly | 2000-01-01 | 2026-04-01 | 316 |
| 35 | AWHAEMAN | Labor market (leading) | fred | monthly | 2006-03-01 | 2026-04-01 | 242 |
| 36 | PERMIT | Housing (leading) | fred | monthly | 2000-01-01 | 2026-04-01 | 316 |
| 37 | HOUST | Housing (leading) | fred | monthly | 2000-01-01 | 2026-04-01 | 316 |
| 38 | NEWORDER | Capex (leading) | fred | monthly | 2000-01-01 | 2026-04-01 | 316 |
| 39 | UMCSENT | Sentiment / expectations | fred | monthly | 2000-01-01 | 2026-04-01 | 316 |
| 40 | EUR/USD | Safe havens & FX | alphavantage | business-day | 2007-04-03 | 2026-06-02 | 5000 |
| 41 | PET.RWTC.D | Energy | eia | business-day | 2006-07-06 | 2026-06-01 | 5000 |
| 42 | EURO | Safe havens & FX | treasury | quarterly | 2001-03-31 | 2026-03-31 | 101 |
Pulled 43/43 instruments across all four free sources.'All instruments pulled successfully.'Issues encountered (honest log). Three findings worth recording, because they shaped the pipeline:
- The keyless FRED path initially failed (
pandas-datareaderis incompatible with pandas 3.x) and was replaced with FRED’s publicfredgraph.csvendpoint. - The IMF “Global price of Wheat” series (
PWHEAMTUSD) was discontinued on FRED; substituted the maintained PPI wheat series (WPU01210101). - The ICE BofA credit-spread series (
BAMLH0A0HYM2HY OAS,BAMLC0A0CMIG OAS) return only ~mid-2023 onward from FRED — a licensing restriction on the free ICE data, identical via the API and the CSV endpoint. Because a credit spread with no past recession in-sample is nearly useless (see §7), we added the free Moody’sBAA10Y/AAA10Yspreads, which span 1990→today (including 2008 and 2020). This fix was prompted directly by the indicator council.
3.4 4. Describe data
| filekey | name | channel | source | asset_type | frequency | start | end | n_rows | n_fields | tz_aware | pct_missing_value | |
|---|---|---|---|---|---|---|---|---|---|---|---|---|
| 0 | DBA | Invesco DB Agriculture Fund | Agricultural commodities | yfinance | equity-ETF | business-day | 2007-01-05 | 2026-06-02 | 4882 | 6 | False | 0.00 |
| 1 | WPU_WHEAT | PPI by Commodity: Farm Products: Wheat | Agricultural commodities | fred | macro-index | monthly | 2000-01-01 | 2026-04-01 | 316 | 1 | False | 0.00 |
| 2 | SPY | SPDR S&P 500 ETF Trust | Broad-market baseline | yfinance | equity-ETF | business-day | 2000-01-03 | 2026-06-02 | 6643 | 6 | False | 0.00 |
| 3 | NEWORDER | Mfrs New Orders: Nondefense Capital Goods ex-A... | Capex (leading) | fred | macro-index | monthly | 2000-01-01 | 2026-04-01 | 316 | 1 | False | 0.00 |
| 4 | COPPER | COMEX Copper Futures (Dr. Copper) | Commodity / growth barometer | yfinance | commodity | business-day | 2000-08-30 | 2026-06-02 | 6467 | 6 | False | 0.00 |
| 5 | AAA10Y | Moody's Aaa Corporate minus 10Y Treasury (cred... | Credit / risk regime | fred | credit-spread | business-day | 2000-01-03 | 2026-06-01 | 6891 | 1 | False | 4.22 |
| 6 | BAA10Y | Moody's Baa Corporate minus 10Y Treasury (cred... | Credit / risk regime | fred | credit-spread | business-day | 2000-01-03 | 2026-06-01 | 6891 | 1 | False | 4.22 |
| 7 | HY_OAS | ICE BofA US High Yield OAS | Credit / risk regime | fred | credit-spread | business-day | 2023-06-05 | 2026-06-02 | 794 | 1 | False | 1.01 |
| 8 | IG_OAS | ICE BofA US Corporate (IG) OAS | Credit / risk regime | fred | credit-spread | business-day | 2023-06-05 | 2026-06-02 | 794 | 1 | False | 1.13 |
| 9 | BTC-USD | Bitcoin (USD) | Crypto (regime-dependent) | yfinance | crypto | daily | 2014-09-17 | 2026-06-02 | 4277 | 6 | False | 0.00 |
| 10 | ETH-USD | Ethereum (USD) | Crypto (regime-dependent) | yfinance | crypto | daily | 2017-11-09 | 2026-06-02 | 3128 | 6 | False | 0.00 |
| 11 | ITA | iShares U.S. Aerospace & Defense ETF | Defense procurement | yfinance | equity-ETF | business-day | 2006-05-05 | 2026-06-02 | 5050 | 6 | False | 0.00 |
| 12 | LMT | Lockheed Martin Corp. | Defense procurement | yfinance | equity | business-day | 2000-01-03 | 2026-06-02 | 6643 | 6 | False | 0.00 |
| 13 | DCOILWTICO | WTI Crude Oil Spot Price | Energy | fred | commodity-price | business-day | 2000-01-03 | 2026-06-01 | 6891 | 1 | False | 3.90 |
| 14 | DHHNGSP | Henry Hub Natural Gas Spot Price | Energy | fred | commodity-price | business-day | 2000-01-03 | 2026-06-01 | 6891 | 1 | False | 3.76 |
| 15 | EIA_WTI | WTI Crude Oil Spot (EIA) | Energy | eia | commodity-price | business-day | 2006-07-06 | 2026-06-01 | 5000 | 1 | False | 0.00 |
| 16 | XLE | Energy Select Sector SPDR Fund | Energy | yfinance | equity-ETF | business-day | 2000-01-03 | 2026-06-02 | 6643 | 6 | False | 0.00 |
| 17 | ANFCI | Chicago Fed Adjusted NFCI | Financial conditions | fred | index | weekly | 2000-01-07 | 2026-05-29 | 1378 | 1 | False | 0.00 |
| 18 | NFCI | Chicago Fed National Financial Conditions Index | Financial conditions | fred | index | weekly | 2000-01-07 | 2026-05-29 | 1378 | 1 | False | 0.00 |
| 19 | INDPRO | Industrial Production Index | Growth (coincident) | fred | macro-index | monthly | 2000-01-01 | 2026-04-01 | 316 | 1 | False | 0.00 |
| 20 | HOUST | New Private Housing Units Started (Housing Sta... | Housing (leading) | fred | macro-index | monthly | 2000-01-01 | 2026-04-01 | 316 | 1 | False | 0.00 |
| 21 | PERMIT | New Private Housing Units Authorized (Building... | Housing (leading) | fred | macro-index | monthly | 2000-01-01 | 2026-04-01 | 316 | 1 | False | 0.00 |
| 22 | T10YIE | 10-Year Breakeven Inflation Rate | Inflation expectations | fred | rate | business-day | 2003-01-02 | 2026-06-02 | 6109 | 1 | False | 4.11 |
| 23 | PAYEMS | All Employees, Total Nonfarm | Labor market (coincident) | fred | macro-index | monthly | 2000-01-01 | 2026-04-01 | 316 | 1 | False | 0.00 |
| 24 | AWHAEMAN | Avg Weekly Hours, Manufacturing | Labor market (leading) | fred | macro-rate | monthly | 2006-03-01 | 2026-04-01 | 242 | 1 | False | 0.00 |
| 25 | ICSA | Initial Unemployment Claims (weekly, SA) | Labor market (leading) | fred | macro-index | weekly | 2000-01-01 | 2026-05-23 | 1378 | 1 | False | 0.00 |
| 26 | M2SL | M2 Money Supply (seasonally adjusted) | Liquidity | fred | macro-level | monthly | 2000-01-01 | 2026-04-01 | 316 | 1 | False | 0.00 |
| 27 | CPILFESL | Core CPI (All Urban, less food & energy) | Macro context | fred | macro-index | monthly | 2000-01-01 | 2026-04-01 | 316 | 1 | False | 0.32 |
| 28 | T10Y3M | 10Y minus 3M Treasury Spread | Macro context | fred | rate-spread | business-day | 2000-01-03 | 2026-06-02 | 6892 | 1 | False | 4.14 |
| 29 | UNRATE | Unemployment Rate | Macro context | fred | macro-rate | monthly | 2000-01-01 | 2026-04-01 | 316 | 1 | False | 0.32 |
| 30 | DFF | Effective Federal Funds Rate | Monetary policy | fred | rate | business-day | 2000-01-01 | 2026-06-02 | 9650 | 1 | False | 0.00 |
| 31 | DFII10 | 10-Year TIPS Real Yield | Real rates | fred | rate | business-day | 2003-01-02 | 2026-06-02 | 6109 | 1 | False | 4.11 |
| 32 | SAHM | Sahm Rule Recession Indicator (real-time) | Recession regime | fred | macro-rate | monthly | 2000-01-01 | 2026-04-01 | 316 | 1 | False | 0.32 |
| 33 | DGS10 | 10-Year Treasury Constant Maturity Rate | Safe havens & FX | fred | rate | business-day | 2000-01-03 | 2026-06-02 | 6892 | 1 | False | 4.14 |
| 34 | DGS2 | 2-Year Treasury Constant Maturity Rate | Safe havens & FX | fred | rate | business-day | 2000-01-03 | 2026-06-02 | 6892 | 1 | False | 4.14 |
| 35 | EURUSD_AV | EUR/USD daily (Alpha Vantage FX_DAILY) | Safe havens & FX | alphavantage | FX | business-day | 2007-04-03 | 2026-06-02 | 5000 | 5 | False | 0.00 |
| 36 | GLD | SPDR Gold Shares | Safe havens & FX | yfinance | equity-ETF | business-day | 2004-11-18 | 2026-06-02 | 5417 | 6 | False | 0.00 |
| 37 | TREAS_EUR | Treasury Reporting Rate of Exchange — Euro | Safe havens & FX | treasury | FX | quarterly | 2001-03-31 | 2026-03-31 | 101 | 1 | False | 0.00 |
| 38 | UUP | Invesco DB US Dollar Index Bullish Fund | Safe havens & FX | yfinance | equity-ETF | business-day | 2007-03-01 | 2026-06-02 | 4845 | 6 | False | 0.00 |
| 39 | VIX | CBOE Volatility Index | Safe havens & FX | yfinance | index | business-day | 2000-01-03 | 2026-06-02 | 6644 | 6 | False | 0.00 |
| 40 | VIXCLS | CBOE Volatility Index (FRED) | Safe havens & FX | fred | index | business-day | 2000-01-03 | 2026-06-02 | 6892 | 1 | False | 3.16 |
| 41 | UMCSENT | University of Michigan Consumer Sentiment | Sentiment / expectations | fred | macro-index | monthly | 2000-01-01 | 2026-04-01 | 316 | 1 | False | 0.00 |
| 42 | BDRY | Breakwave Dry Bulk Shipping ETF | Shipping & insurance | yfinance | equity-ETF | business-day | 2018-03-22 | 2026-06-02 | 2060 | 6 | False | 0.00 |
Two structural facts dominate the description and drive Phase 3:
- Inception heterogeneity. Histories start at very different dates — SPY/LMT/^VIX and many FRED series (including the newly-added claims, permits, starts, payrolls, hours, and sentiment leads, whose native FRED histories run for decades) reach back to 2000, but GLD begins 2004, ITA 2006, UUP/DBA 2007, BTC 2014, ETH 2017, and BDRY only 2018; the ICE OAS series only ~2023. Any cross-asset model must handle ragged start dates rather than assume a common window.
- Frequency mix. Business-day equities/ETFs (~252 obs/yr), 7-day crypto, business-day FRED rates/spots (weekend gaps), weekly NFCI/ANFCI, and monthly macro (CPI, unemployment, M2, industrial production, Sahm, wheat PPI) coexist. Naive joining would silently drop weekends or fabricate values — handled as a quality finding in §7 and an alignment task in §9.
3.5 5. Indicator framework: mapping data to strategy
strategy.md’s organizing principle is that individual indicators are noisy and regime-dependent; their value comes from combining them (diffusion indices, z-scores, multi-signal confirmation). Its highest-conviction signals form a “Stage-1 regime dashboard”: yield curve, credit spreads, financial conditions, the Sahm rule, VIX, copper/gold, and the dollar. The expansion in this revision was chosen to assemble that dashboard from free data.
3.5.1 5.1 The highest-value indicators, ranked for the prediction model
The request behind this project — “which assets will rise the most and should be bought?” — is, in this universe, a risk-adjusted question, not a raw-return one. With only ~11 tradable proxies there is no broad cross-section to mine for classic value/quality factors (see §8), and Chapter 1’s objective is Sharpe, not maximum nominal gain. So “highest value” here means best forecast of risk-adjusted forward return, and the answer is a two-layer structure: a regime/exposure layer that decides how much to be invested, and a thin momentum layer that ranks which proxy leads. Momentum is the one signal that directly ranks winners — but it is also the biggest drawdown engine (it crashes in sharp reversals: 2009, March 2020), so it is volatility-scaled in Phase 3. Ranked by documented value for this problem:
| Tier | Indicators | Job | Why it’s high-value | Built in Phase 3 as |
|---|---|---|---|---|
| 1 — gate + rank | momentum 12-1m; BAA10Y credit spread; curve T10Y3M & 10y-2y; NFCI/ANFCI; VIX |
momentum ranks winners; the rest gate gross exposure | momentum = most robust forward-return signal across markets/assets; credit/curve/financial-conditions = best-documented forward-return-regime leads | vol-scaled momentum + cross-sectional rank; equal-weighted regime score |
| 2 — route | breakevens T10YIE vs real DFII10; copper/gold; dollar UUP; SAHM; LEI proxy |
route capital to the channel the regime favors | reflation/stagflation quadrant decides commodity-vs-safe-haven; Dr. Copper = growth barometer; Sahm = recession onset | quadrant label; copper_gold_z; sahm_flag; lei_diffusion |
| 3 — new free leads | ICSA, PERMIT, HOUST, NEWORDER, UMCSENT, AWHAEMAN, PAYEMS |
earlier recession leads + LEI components | timeliest labor lead; rate-sensitive housing lead; core-capex lead — all Conference-Board LEI inputs | feed the diffusion-LEI proxy |
| deferred | value/quality factors; on-chain MVRV/SOPR; ISM-PMI; MOVE; AAII; CAPE | — | high value but need single-name fundamentals or paid/licensed data | documented gap (§8) |
3.5.2 5.2 Full mapping: our snapshot onto the catalog’s taxonomy
The mapping of our snapshot onto the catalog’s taxonomy:
| strategy.md category | Type | Our instruments | Signal use | Reliability caveat |
|---|---|---|---|---|
| Yield curve | Market-based lead | DGS10, DGS2, T10Y3M |
recession lead; slope and disinversion | gave a false signal 2022–24 |
| Credit spreads | Market-based lead | BAA10Y, AAA10Y (1990+); HY_OAS,IG_OAS (2023+) |
risk-off early warning | ICE OAS history licensing-capped → lean on Moody’s |
| Financial conditions | Market-based | NFCI, ANFCI |
tightening leads slowdowns | ANFCI strips the cycle |
| Volatility | Market-based | VIX, VIXCLS |
risk-off regime; vol-scaling | coincident; low VIX = complacency |
| Inflation exp. / real rates | Market-based | T10YIE, DFII10 |
reflation-vs-stagflation quadrant; gold driver | from 2003 only |
| Policy / liquidity | Monetary | DFF, M2SL |
risk anchor; liquidity | money→inflation link loose |
| Growth | Coincident | INDPRO, SPY |
business-cycle state | — |
| Labor market | Leading + coincident | ICSA (lead, inverted), AWHAEMAN (lead), PAYEMS (coincident) |
timeliest labor turn; LEI inputs | claims noisy weekly → 4-wk MA |
| Housing | Market-based lead | PERMIT, HOUST |
rate-sensitive early lead | permits lead starts |
| Capex / orders | Leading | NEWORDER |
core-capex lead; LEI input | core series cleaner than headline durables |
| Consumer expectations | Leading (soft) | UMCSENT |
LEI consumer-expectations input | survey; weak short-term predictor |
| Recession onset | Regime | SAHMREALTIME (+UNRATE) |
onset trigger (≥0.50) | coincident-early; labor-supply distortion |
| Inflation / labor | Lagging | CPILFESL, UNRATE |
not forward signals | catalog’s named trap |
| Commodities / Dr. Copper | Commodity | COPPER, DCOILWTICO, DHHNGSP, wheat |
growth barometer; copper/gold | spot vs ETF proxy |
| FX / dollar | Currency | UUP, EURUSD_AV, TREAS_EUR |
dollar smile; risk-off | proxies |
| Equity channels | — | XLE,ITA,LMT,DBA,BDRY |
transmission-channel proxies | proxies, not the underlying |
| Crypto | — | BTC-USD, ETH-USD |
regime-dependent | on-chain MVRV not free (gap) |
| Factor premia | Equity factor | none buildable | value/mom/quality | needs single-name cross-section (gap) |
| LEI / ISM-PMI | Composite lead | components: AWHAEMAN,ICSA,PERMIT,NEWORDER,UMCSENT,SPY,(10y−FF) |
homemade diffusion-LEI proxy (Phase 3) | only ISM new orders, Leading Credit Index & consumer-goods orders still licensed |
The dashboard is now assembled from free data: curve ✓, credit ✓ (BAA10Y), financial conditions ✓ (NFCI/ANFCI), Sahm ✓, VIX ✓, copper/gold ✓, dollar ✓ — and this revision adds the free leading-indicator block (initial claims, building permits/starts, core-capex orders, consumer sentiment, manufacturing hours) that lets a diffusion-LEI proxy stand in for the licensed Conference-Board index. Only ISM new orders, the Leading Credit Index, consumer-goods orders, and survivorship-free single-name fundamentals remain out of reach.
3.5.3 5.3 Credit spread — the recession-tested risk gauge
fig, ax = plt.subplots(figsize=(10, 4.2))
baa = panel["BAA10Y"].dropna()
ax.plot(baa.index, baa, color="tab:purple", linewidth=1.0, label="Baa − 10Y (BAA10Y)")
ax.axhline(baa.median(), color="grey", ls="--", lw=0.8, label="median")
ax.set_ylabel("Credit spread (pp)")
ax.set_title("Moody's Baa credit spread — the recession-spanning risk-regime signal")
ax.legend(loc="upper right", fontsize=9)
plt.tight_layout()
plt.show()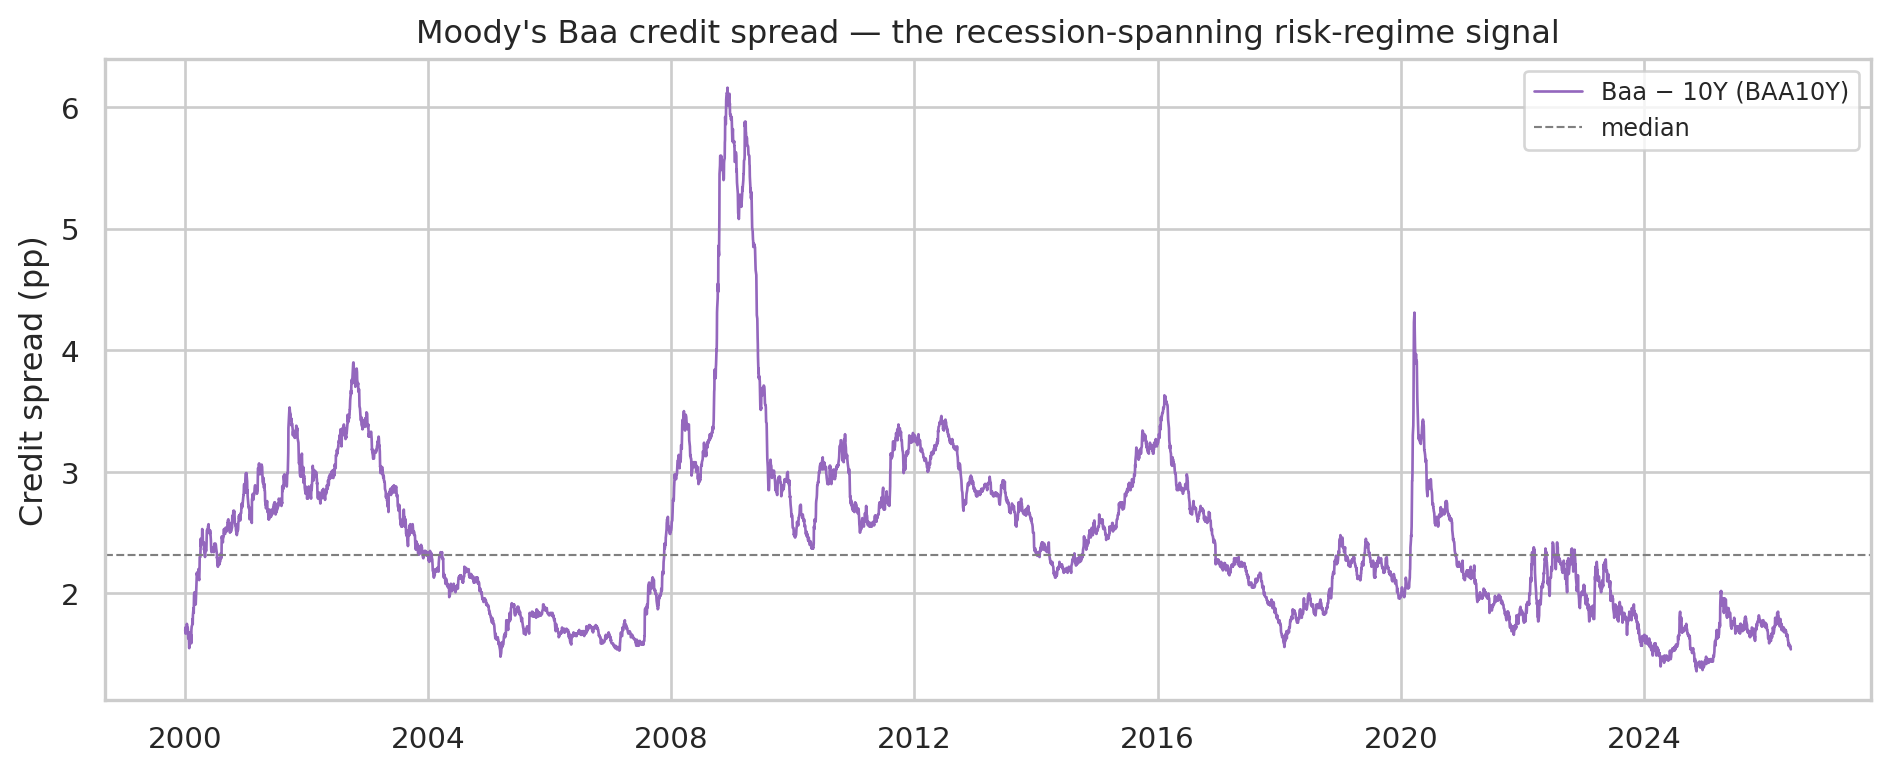
3.5.4 5.4 Yield curve — slope and inversions
fig, ax = plt.subplots(figsize=(10, 4.2))
curve = panel["T10Y3M"].dropna()
ax.plot(curve.index, curve, color="tab:blue", linewidth=0.9)
ax.axhline(0, color="black", lw=0.8)
ax.fill_between(curve.index, curve, 0, where=(curve < 0), color="tab:red", alpha=0.4,
                label="inverted (recession lead / false-signal risk)")
ax.set_ylabel("10y − 3m spread (pp)")
ax.set_title("Yield-curve slope")
ax.legend(loc="lower right", fontsize=9)
plt.tight_layout()
plt.show()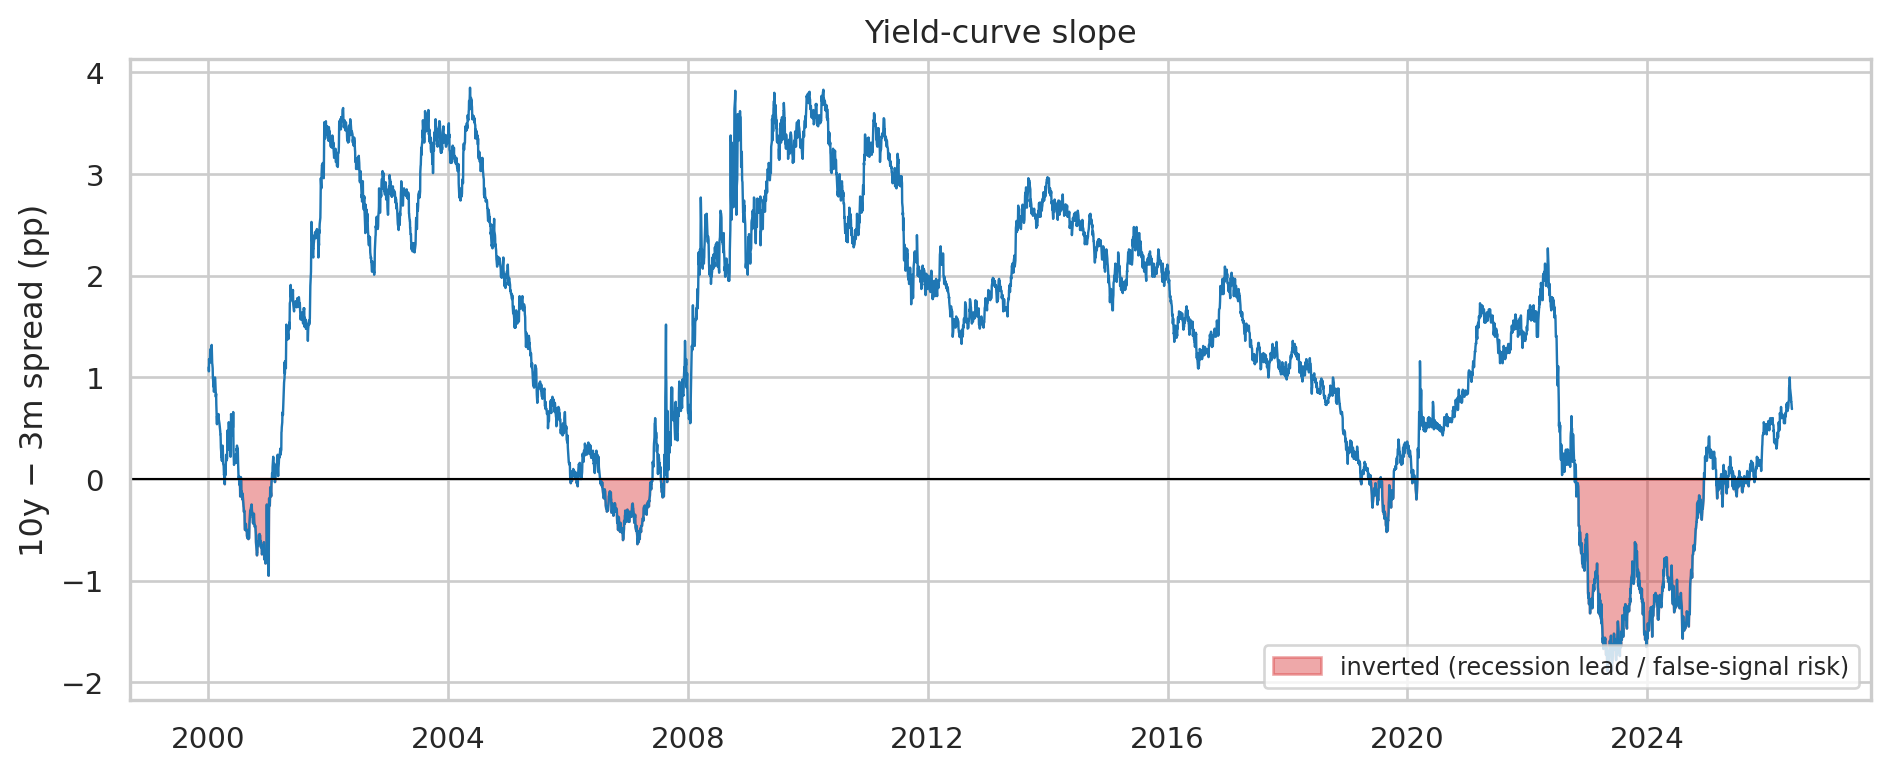
3.5.5 5.5 Copper/gold ratio vs. the 10-year yield
fig, ax1 = plt.subplots(figsize=(10, 4.2))
cg = (panel["COPPER"] / panel["GLD"]).dropna()
ax1.plot(cg.index, cg, color="tab:orange", linewidth=1.0, label="copper/gold (proxy)")
ax1.set_ylabel("copper / gold (ratio, proxy)", color="tab:orange")
ax2 = ax1.twinx()
dgs10 = panel["DGS10"].dropna()
ax2.plot(dgs10.index, dgs10, color="tab:blue", linewidth=0.9, label="10y yield (DGS10)")
ax2.set_ylabel("10y yield (%)", color="tab:blue")
ax1.set_title("Copper/gold vs. the 10-year yield")
plt.tight_layout()
plt.show()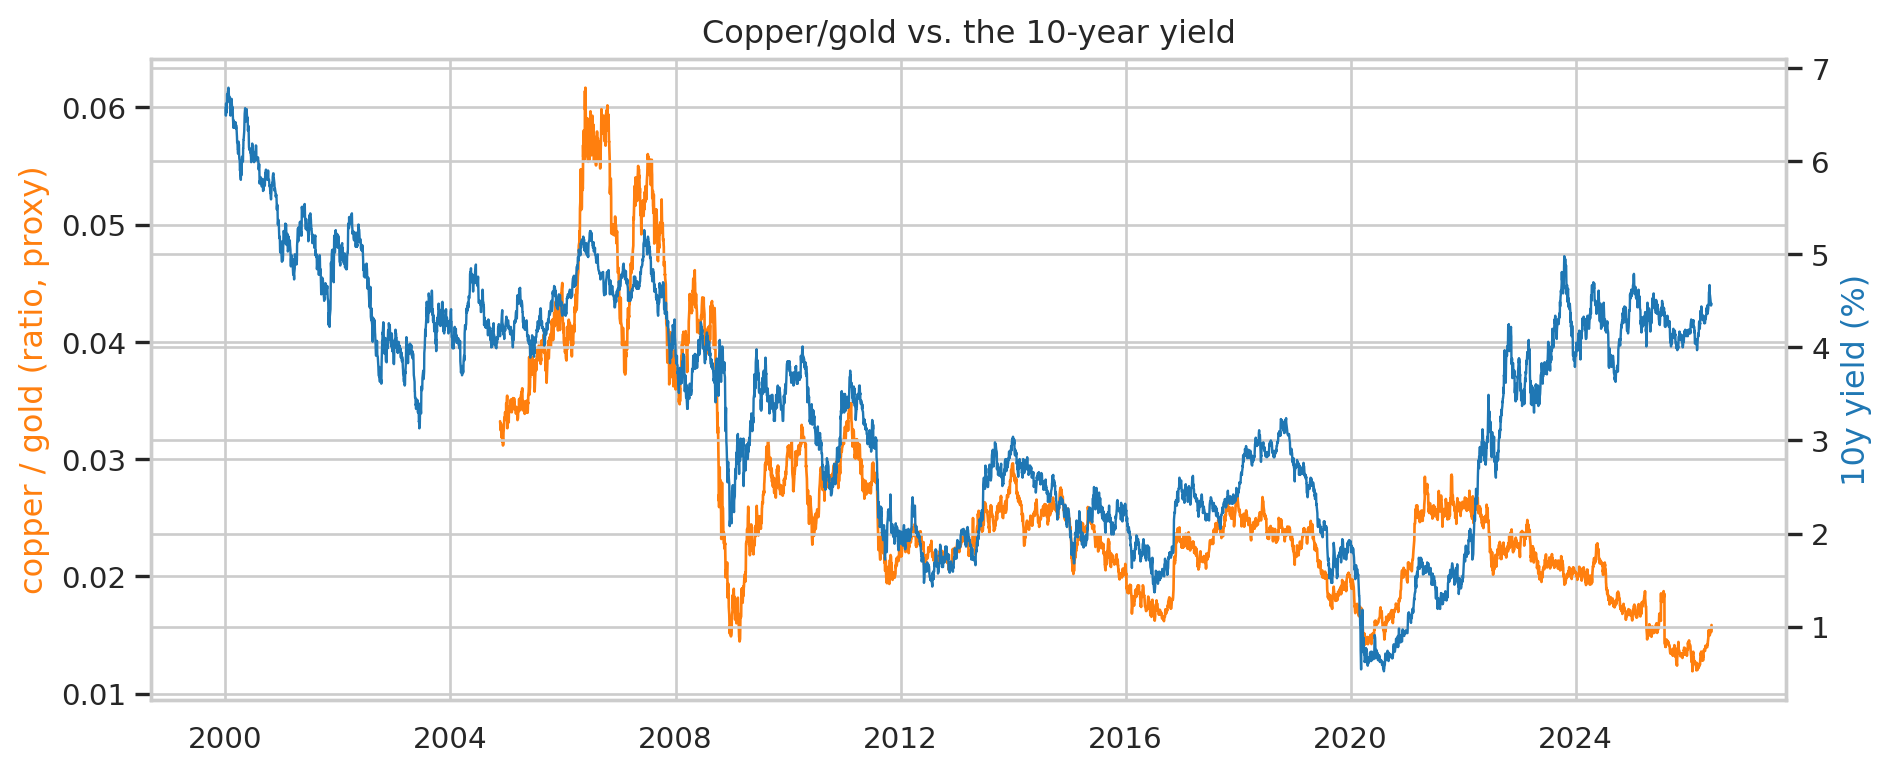
3.5.6 5.6 Newly-added leading indicators (descriptive)
The free leading-indicator block added in this revision — describing the data as it exists, before any feature is built from it (that is Phase 3):
fig, ax1 = plt.subplots(figsize=(10, 4.2))
claims = (panel["ICSA"].dropna().rolling(4).mean()) / 1000
ax1.plot(claims.index, claims, color="tab:red", lw=0.8, label="initial claims, 4-wk MA")
ax1.set_ylabel("initial claims (000s)", color="tab:red")
ax2 = ax1.twinx()
permit = panel["PERMIT"].dropna()
ax2.plot(permit.index, permit, color="tab:green", lw=1.0, label="building permits")
ax2.set_ylabel("building permits (000s)", color="tab:green")
ax1.set_title("New leading indicators — labor (claims) & housing (permits)")
plt.tight_layout()
plt.show()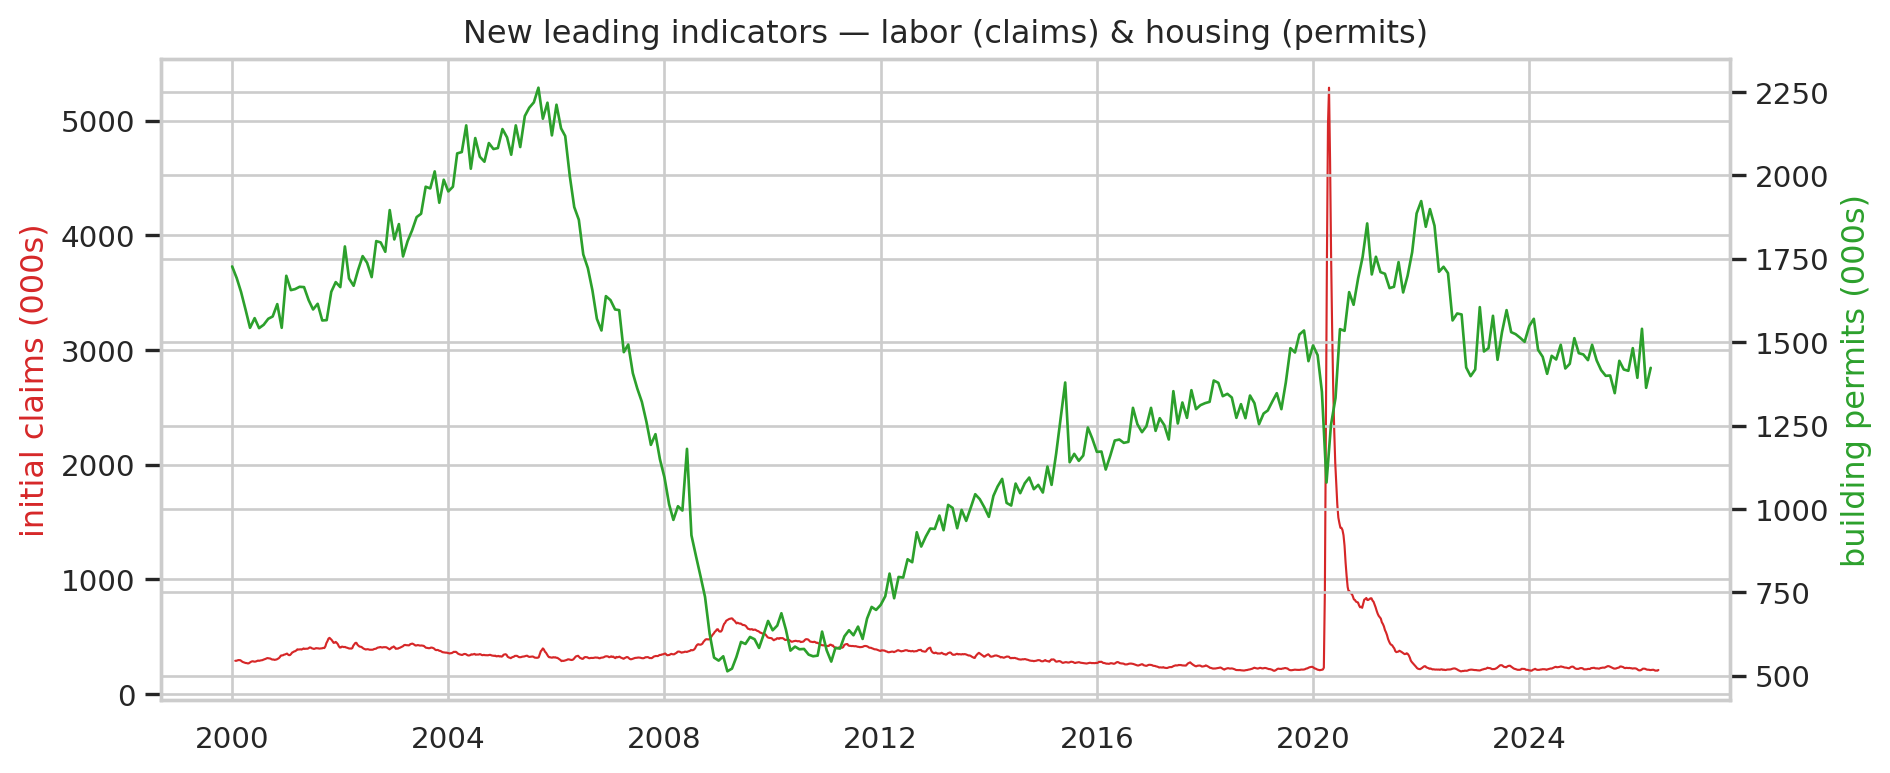
3.6 6. Explore data
3.6.1 6.1 Summary statistics
| count | mean | std | min | 25% | 50% | 75% | max | pct_missing | |
|---|---|---|---|---|---|---|---|---|---|
| SPY | 6643.0 | 203.78 | 163.61 | 49.81 | 84.97 | 124.05 | 268.01 | 759.57 | 31.16 |
| XLE | 6643.0 | 21.46 | 11.07 | 5.18 | 13.82 | 21.31 | 25.63 | 62.56 | 31.16 |
| ITA | 5050.0 | 70.83 | 49.99 | 11.72 | 26.48 | 55.78 | 100.91 | 250.42 | 47.67 |
| DBA | 4882.0 | 20.71 | 4.68 | 11.61 | 17.24 | 20.89 | 23.97 | 36.25 | 49.41 |
| BDRY | 2060.0 | 13.34 | 7.23 | 3.91 | 7.78 | 10.72 | 18.61 | 41.51 | 78.65 |
| GLD | 5417.0 | 142.02 | 72.37 | 41.26 | 107.29 | 125.54 | 167.39 | 495.90 | 43.87 |
| UUP | 4845.0 | 21.48 | 2.77 | 17.48 | 19.25 | 20.97 | 22.63 | 28.86 | 49.79 |
| BTC-USD | 4277.0 | 28612.41 | 32441.10 | 178.10 | 3457.79 | 11542.50 | 46368.59 | 124752.53 | 55.68 |
| ETH-USD | 3128.0 | 1716.11 | 1274.53 | 84.31 | 380.34 | 1733.03 | 2662.88 | 4831.35 | 67.59 |
| LMT | 6643.0 | 167.62 | 158.59 | 8.55 | 42.15 | 66.04 | 298.14 | 672.30 | 31.16 |
| COPPER | 6467.0 | 2.89 | 1.23 | 0.60 | 2.15 | 3.06 | 3.72 | 6.65 | 32.98 |
| VIX | 6644.0 | 19.83 | 8.31 | 9.14 | 14.03 | 17.82 | 23.21 | 82.69 | 31.15 |
3.6.2 6.2 Normalized price history by channel
Each tradable proxy is indexed to 100 at its first available observation (log scale, so different inception dates and magnitudes are comparable):
fig, ax = plt.subplots(figsize=(10, 5.5))
for fk in ["SPY", "XLE", "ITA", "GLD", "BTC-USD"]:
    s = panel[fk].dropna()
    if len(s):
        ax.plot(s.index, 100 * s / s.iloc[0], label=fk, linewidth=1.3)
ax.set_yscale("log")
ax.set_ylabel("Indexed to 100 at inception (log)")
ax.set_title("Transmission-channel proxies, normalized")
ax.legend(loc="upper left", ncol=3, fontsize=9)
plt.tight_layout()
plt.show()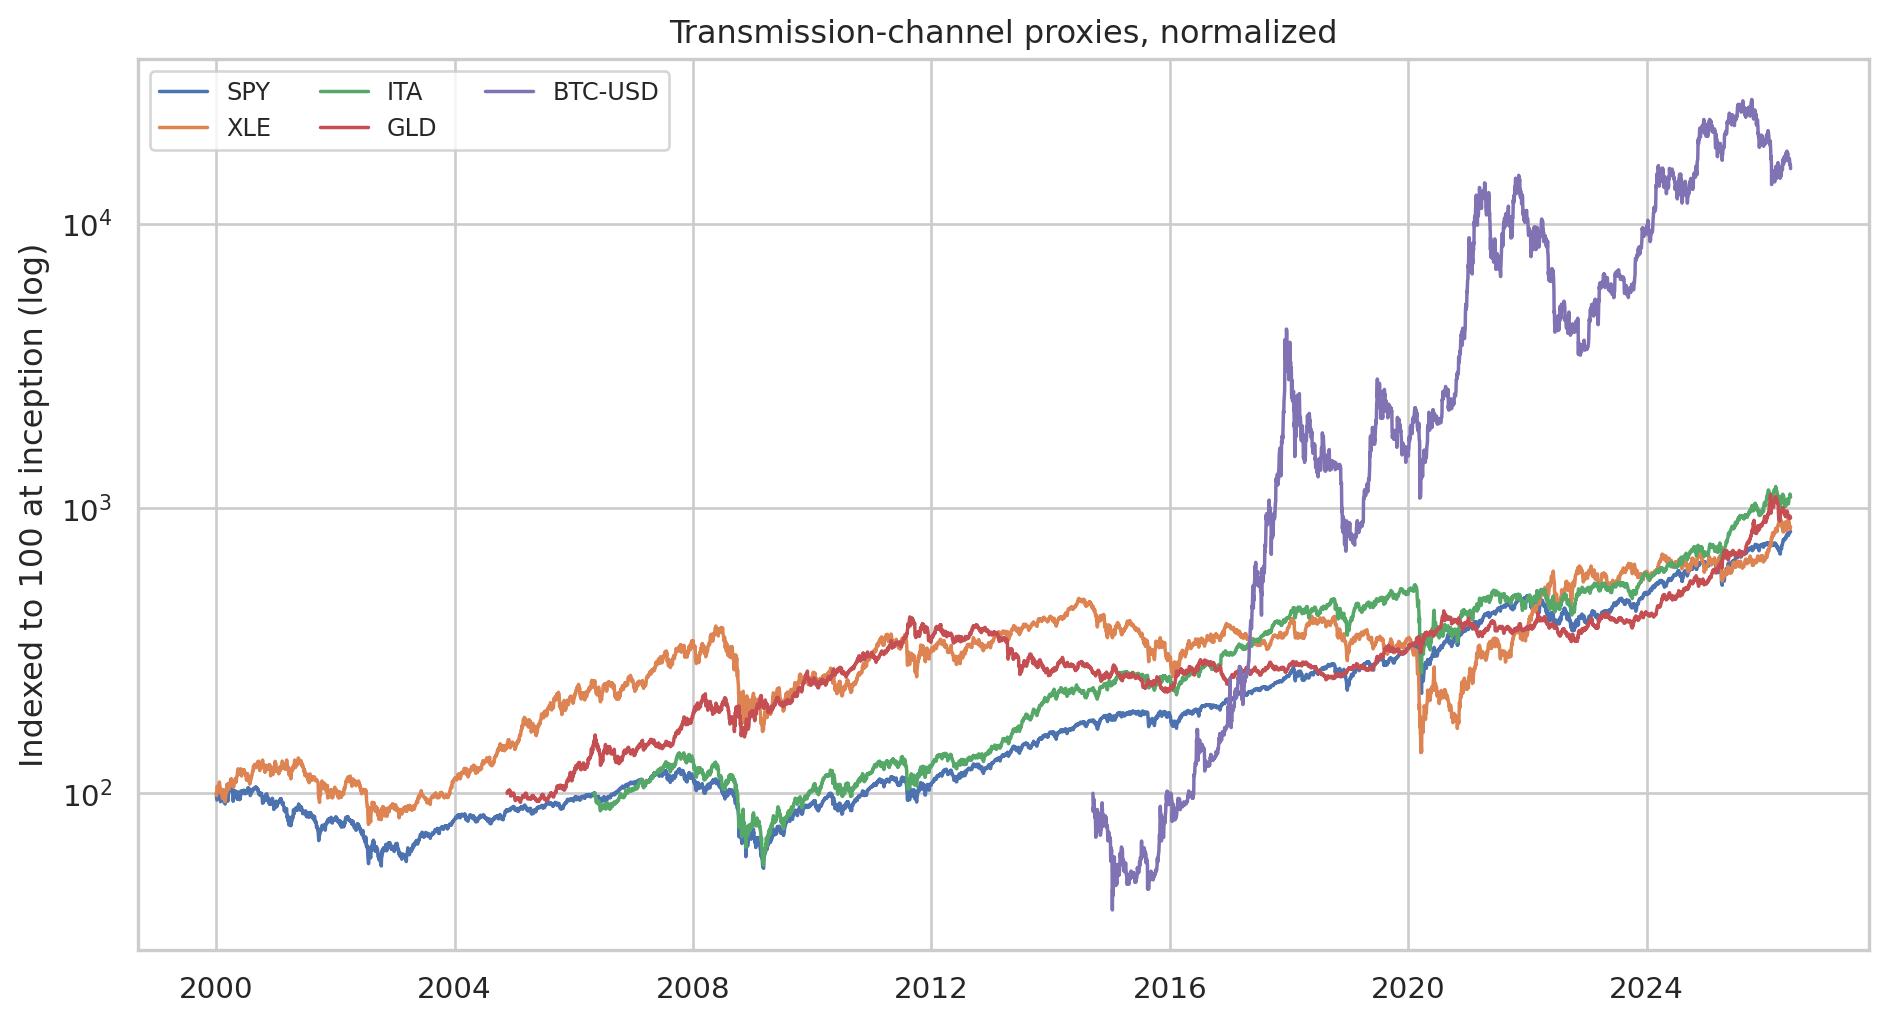
3.6.3 6.3 Rolling volatility (risk regimes)
rets = q.returns_panel(panel[["SPY", "GLD", "BTC-USD"]], kind="log")
vol = rets.rolling(30).std() * np.sqrt(252)
fig, ax = plt.subplots(figsize=(10, 4.5))
for c in vol.columns:
    ax.plot(vol.index, vol[c], label=c, linewidth=1.1)
ax.set_ylabel("Annualized volatility")
ax.set_title("30-day rolling volatility")
ax.legend(loc="upper right")
plt.tight_layout()
plt.show()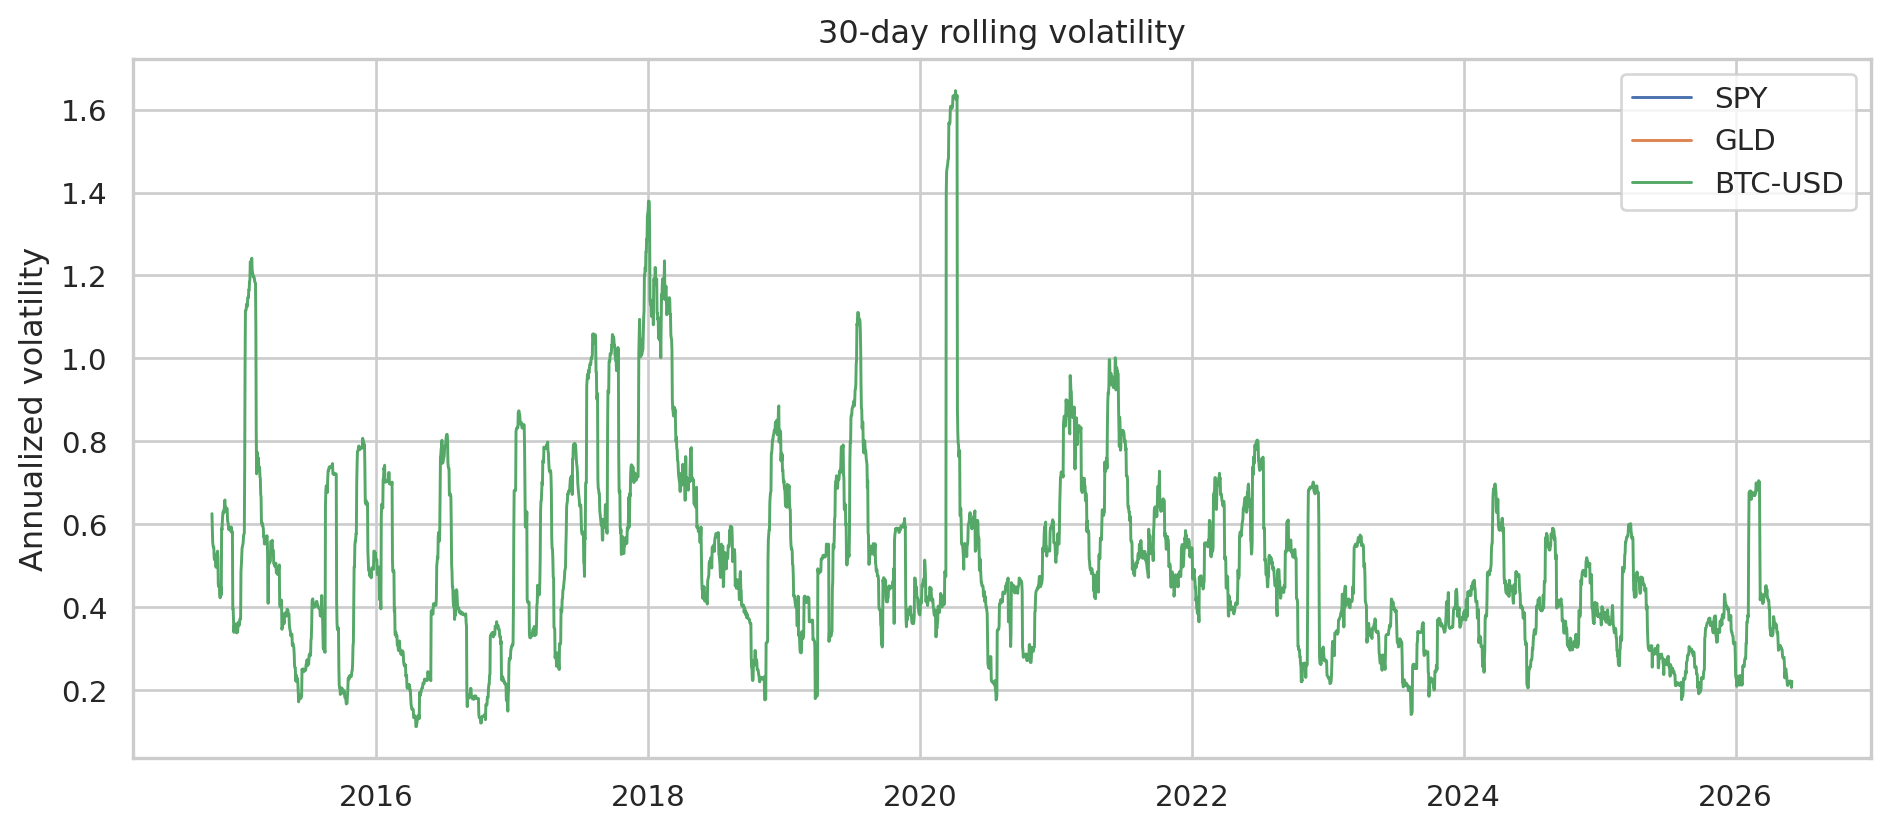
3.6.4 6.4 Cross-asset return correlation
cm = q.correlation_matrix(panel, TRADABLE)
fig, ax = plt.subplots(figsize=(9, 7.5))
sns.heatmap(cm, annot=True, fmt=".2f", cmap="vlag", center=0,
            square=True, cbar_kws={"shrink": 0.8}, ax=ax)
ax.set_title("Daily-return correlation")
plt.tight_layout()
plt.show()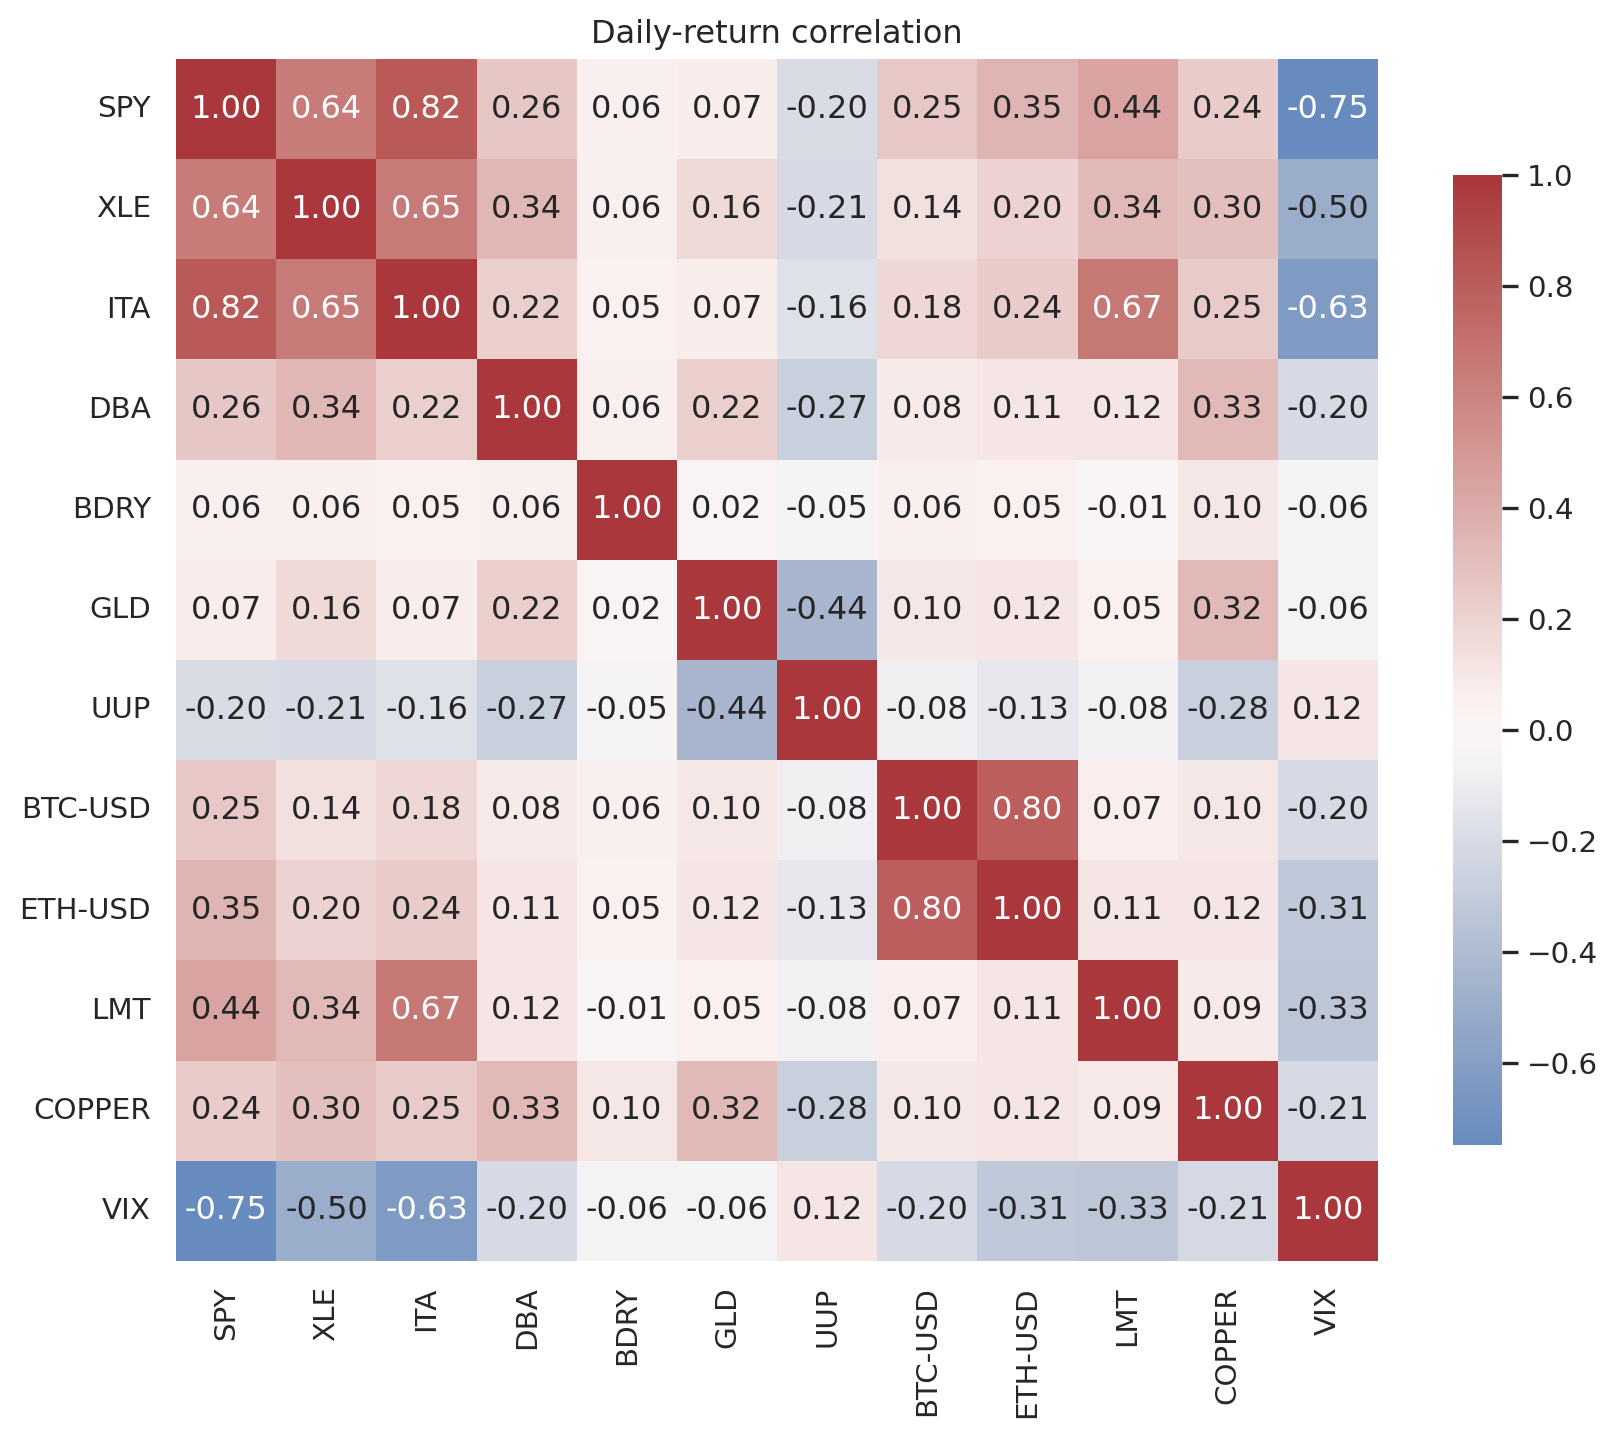
3.6.5 6.5 First hypotheses (to be tested, not findings)
These are explicitly labelled hypotheses — exploratory patterns to be validated with rigor in later phases, never treated as confirmed edges:
- H1 (channel structure). Energy equity (XLE) co-moves with crude; defense (ITA/LMT) and gold (GLD) show partly diversifying profiles vs. the broad market (SPY).
- H2 (crypto regime-switching). BTC’s correlation with SPY is not constant — likely rising in risk-on periods and breaking around stress, consistent with the Phase-1 “regime-dependent” claim.
- H3 (risk-off signature). VIX spikes, credit-spread (BAA10Y) widening, and curve dynamics should cluster around equity drawdowns — motivating a combined regime read rather than any single signal.
3.7 7. Verify data quality
3.7.1 7.1 Quality scorecard
| filekey | channel | freq | n_rows | missing | pct_missing | duplicate_idx | ordered | stale(>=5) | max_stale_run | positivity | lookahead_release_lag | |
|---|---|---|---|---|---|---|---|---|---|---|---|---|
| 0 | DBA | Agricultural commodities | business-day | 4882 | pass | 0.00 | pass | pass | pass | 2 | pass | pass |
| 1 | WPU_WHEAT | Agricultural commodities | monthly | 316 | pass | 0.00 | pass | pass | pass | 1 | n/a | review |
| 2 | SPY | Broad-market baseline | business-day | 6643 | pass | 0.00 | pass | pass | pass | 1 | pass | pass |
| 3 | NEWORDER | Capex (leading) | monthly | 316 | pass | 0.00 | pass | pass | pass | 0 | n/a | review |
| 4 | COPPER | Commodity / growth barometer | business-day | 6467 | pass | 0.00 | pass | pass | pass | 2 | n/a | pass |
| 5 | AAA10Y | Credit / risk regime | business-day | 6891 | warn | 4.22 | pass | pass | warn | 7 | n/a | pass |
| 6 | BAA10Y | Credit / risk regime | business-day | 6891 | warn | 4.22 | pass | pass | warn | 6 | n/a | pass |
| 7 | HY_OAS | Credit / risk regime | business-day | 794 | warn | 1.01 | pass | pass | pass | 2 | n/a | pass |
| 8 | IG_OAS | Credit / risk regime | business-day | 794 | warn | 1.13 | pass | pass | warn | 10 | n/a | pass |
| 9 | BTC-USD | Crypto (regime-dependent) | daily | 4277 | pass | 0.00 | pass | pass | pass | 1 | pass | pass |
| 10 | ETH-USD | Crypto (regime-dependent) | daily | 3128 | pass | 0.00 | pass | pass | pass | 0 | pass | pass |
| 11 | ITA | Defense procurement | business-day | 5050 | pass | 0.00 | pass | pass | pass | 2 | pass | pass |
| 12 | LMT | Defense procurement | business-day | 6643 | pass | 0.00 | pass | pass | pass | 1 | pass | pass |
| 13 | DCOILWTICO | Energy | business-day | 6891 | warn | 3.90 | pass | pass | pass | 2 | fail | pass |
| 14 | DHHNGSP | Energy | business-day | 6891 | warn | 3.76 | pass | pass | warn | 10 | pass | pass |
| 15 | EIA_WTI | Energy | business-day | 5000 | pass | 0.00 | pass | pass | pass | 1 | fail | pass |
| 16 | XLE | Energy | business-day | 6643 | pass | 0.00 | pass | pass | pass | 2 | pass | pass |
| 17 | ANFCI | Financial conditions | weekly | 1378 | pass | 0.00 | pass | pass | pass | 2 | n/a | pass |
| 18 | NFCI | Financial conditions | weekly | 1378 | pass | 0.00 | pass | pass | warn | 5 | n/a | pass |
| 19 | INDPRO | Growth (coincident) | monthly | 316 | pass | 0.00 | pass | pass | pass | 0 | n/a | review |
| 20 | HOUST | Housing (leading) | monthly | 316 | pass | 0.00 | pass | pass | pass | 1 | n/a | review |
| 21 | PERMIT | Housing (leading) | monthly | 316 | pass | 0.00 | pass | pass | pass | 0 | n/a | review |
| 22 | T10YIE | Inflation expectations | business-day | 6109 | warn | 4.11 | pass | pass | warn | 5 | n/a | pass |
| 23 | PAYEMS | Labor market (coincident) | monthly | 316 | pass | 0.00 | pass | pass | pass | 1 | n/a | review |
| 24 | AWHAEMAN | Labor market (leading) | monthly | 242 | pass | 0.00 | pass | pass | warn | 8 | n/a | review |
| 25 | ICSA | Labor market (leading) | weekly | 1378 | pass | 0.00 | pass | pass | pass | 2 | n/a | pass |
| 26 | M2SL | Liquidity | monthly | 316 | pass | 0.00 | pass | pass | pass | 0 | n/a | review |
| 27 | CPILFESL | Macro context | monthly | 316 | warn | 0.32 | pass | pass | pass | 2 | n/a | review |
| 28 | T10Y3M | Macro context | business-day | 6892 | warn | 4.14 | pass | pass | pass | 3 | n/a | pass |
| 29 | UNRATE | Macro context | monthly | 316 | warn | 0.32 | pass | pass | pass | 4 | n/a | review |
| 30 | DFF | Monetary policy | business-day | 9650 | pass | 0.00 | pass | pass | warn | 419 | n/a | pass |
| 31 | DFII10 | Real rates | business-day | 6109 | warn | 4.11 | pass | pass | pass | 3 | n/a | pass |
| 32 | SAHM | Recession regime | monthly | 316 | warn | 0.32 | pass | pass | pass | 3 | n/a | review |
| 33 | DGS10 | Safe havens & FX | business-day | 6892 | warn | 4.14 | pass | pass | pass | 4 | n/a | pass |
| 34 | DGS2 | Safe havens & FX | business-day | 6892 | warn | 4.14 | pass | pass | warn | 7 | n/a | pass |
| 35 | EURUSD_AV | Safe havens & FX | business-day | 5000 | pass | 0.00 | pass | pass | pass | 2 | pass | pass |
| 36 | GLD | Safe havens & FX | business-day | 5417 | pass | 0.00 | pass | pass | pass | 1 | pass | pass |
| 37 | TREAS_EUR | Safe havens & FX | quarterly | 101 | pass | 0.00 | pass | pass | pass | 1 | pass | pass |
| 38 | UUP | Safe havens & FX | business-day | 4845 | pass | 0.00 | pass | pass | pass | 3 | pass | pass |
| 39 | VIX | Safe havens & FX | business-day | 6644 | pass | 0.00 | pass | pass | pass | 2 | n/a | pass |
| 40 | VIXCLS | Safe havens & FX | business-day | 6892 | warn | 3.16 | pass | pass | pass | 2 | n/a | pass |
| 41 | UMCSENT | Sentiment / expectations | monthly | 316 | pass | 0.00 | pass | pass | pass | 1 | n/a | review |
| 42 | BDRY | Shipping & insurance | business-day | 2060 | pass | 0.00 | pass | pass | warn | 7 | pass | pass |
3.7.2 7.2 Cross-source consistency
Where two sources measure the same concept, they should agree — a direct quality probe:
| series_a | series_b | overlap_rows | level_corr | |
|---|---|---|---|---|
| 0 | VIX | VIXCLS | 6644 | 1.0 |
| 1 | DCOILWTICO | EIA_WTI | 4988 | 1.0 |
^VIX (yfinance) vs VIXCLS (FRED) and DCOILWTICO (FRED WTI) vs the EIA WTI series give two clean cross-source validations across three independent providers.
3.7.3 7.3 Material quality findings
Minimum WTI value in snapshot: -36.98 on 2020-04-20
ICE HY OAS free history: 786 rows from 2023-06-05 (licensing-capped)- Negative oil price (real, not an error). WTI’s minimum is the negative print of April 2020 — a genuine market event. It breaks log-return math and any “prices are positive” assumption.
- Credit-spread history is licensing-capped. The ICE BofA OAS series everyone reaches for first only exist from ~2023 on the free tier — zero past recessions in-sample. The council flagged this as the debate’s blind spot; the fix was the free Moody’s
BAA10Y(1990+). A signal you can’t observe across a recession can’t be calibrated on data you own. - Calendar misalignment. Crypto trades 7 days/week; equities ~5; NFCI is weekly; macro is monthly. Per-series statistics use each series’ native frequency; any aligned view must not be read as if all series share a calendar.
- Look-ahead / release lag. Monthly macro (CPI, unemployment, M2, industrial production, Sahm) is stamped by reference period, known only on the later release date. Phase 3 must lag these by their publication delay — the exact trap Chapter 1 warned about.
- Survivorship & venue caveats. Free equity sources omit delisted names (ETFs only partly mitigate); yfinance crypto is an aggregate, not a single venue. Acceptable for this PoC; flagged before any Phase-4 backtest.
3.8 8. Gaps vs. the strategy & geopolitical thesis
The free sources cannot supply several things strategy.md and the Chapter-1 thesis ultimately want. Named honestly so they are not silently assumed:
- Licensed composites — Conference Board LEI, ISM/PMI — the headline indices are not free, but this revision adds 7 of the 10 LEI components (manufacturing hours, initial claims, building permits, core capital-goods orders, consumer expectations, the S&P 500, and the 10y−fed-funds spread), so a homemade diffusion-LEI proxy is buildable in Phase 3; only ISM new orders, the Leading Credit Index, and consumer-goods orders remain licensed.
- Long ICE BofA credit history — licensing-capped to ~2023; Moody’s
BAA10Ysubstitutes. - Shiller CAPE — a long-horizon equity-valuation gauge; not on FRED’s keyless path (needs Shiller’s dataset) and weak for short-term timing, so deferred as off-thesis for a regime/momentum model.
- Cross-sectional equity factors (value/momentum/quality) — need a survivorship-bias-free single-name universe (CRSP-style); unbuildable on a dozen ETFs + two single names.
- Quantified geopolitical event data (GDELT/ACLED/ICEWS) — deferred to a later phase, consistent with baseline-first; proxied for now by VIX, credit, and the conflict-sensitive sleeves.
- Crypto on-chain (MVRV/SOPR) and real freight indices (Baltic Dry) — paid; proxied by price/volume and the BDRY ETF.
3.9 9. Implications for Data Preparation (Phase 3 hand-off)
Phase 3 must enforce the discipline strategy.md spells out, or any “edge” we find will be an artifact:
- Point-in-time / vintage data. Source macro features from ALFRED (not revised FRED) and lag every release to its actual publication date — this is the real reason to hold the FRED API key.
- Stationary, comparable features. Transform levels to YoY/MoM changes, rolling z-scores, percentile ranks, and diffusion indices; spreads/ratios (curve slope, copper/gold, BAA−AAA); volatility-scaled 12-1 momentum (the return-ranking signal) and the diffusion-LEI proxy from the new leading-indicator block; standardized surprise (actual − consensus) where a consensus feed exists. These are now built in Data Preparation.
- Master calendar & alignment. Business-day master index; resample crypto to it (keeping a native 7-day view); lag-aware fills for weekly/monthly macro — never fill across the release frontier.
- Anti-overfitting discipline. With only ~3–4 genuine regime episodes in 25 years, prefer a small, fixed, equal-weighted regime score over fitted weights; validate with purged/embargoed walk-forward CV, deflated Sharpe, and elevated t-stat hurdles; benchmark against dumb buy-and-hold SPY and 60/40.
- Council’s steer. Use the combined regime read as a gross-exposure / volatility-scaling dial, not a buy/sell trigger; route the conflict-sensitive sleeve by the reflation-vs-stagflation quadrant (
T10YIEvsDFII10); defer factors and crypto on-chain until their data is funded. See the Indicator Council Deliberation. → Data Preparation.
3.10 10. Reproducibility
Snapshot vintage : 2026-06-03
Instruments      : 43
Python           : 3.12.13
pandas           : 3.0.3
numpy            : 2.4.6
yfinance         : 1.4.1
To reproduce or refresh the snapshot:
- Create the environment:
python -m venv .venv, activate it,pip install -r requirements.txt. - Register the kernel:
python -m ipykernel install --user --name portfoliolens(matchesjupyter: portfoliolensin_quarto.yml). - Copy
.env.exampleto.envand add free keys (optional —yfinance/FRED/Treasury run without). - Pull:
python scripts/poc_pull.py→ writesdata/raw/and the committeddata/snapshot/. - Render: with the venv active,
quarto render— it reads the snapshot only (no network, no keys).
The small data/snapshot/ (parquet + manifest.csv) is committed so a fresh clone renders this chapter without any pull; bulk data/raw/ is gitignored.
Phase-2 deliverables — complete: initial data collection report (§3), data description report (§4), an indicator-framework mapping to strategy.md (§5), data exploration report (§6), and data quality report (§7) — over 43 instruments of real, free-sourced data spanning 2000–2026, with the expert debate in the Indicator Council appendix.